- Home
- Press Release
- LE Audio: Should I include it in my new design?
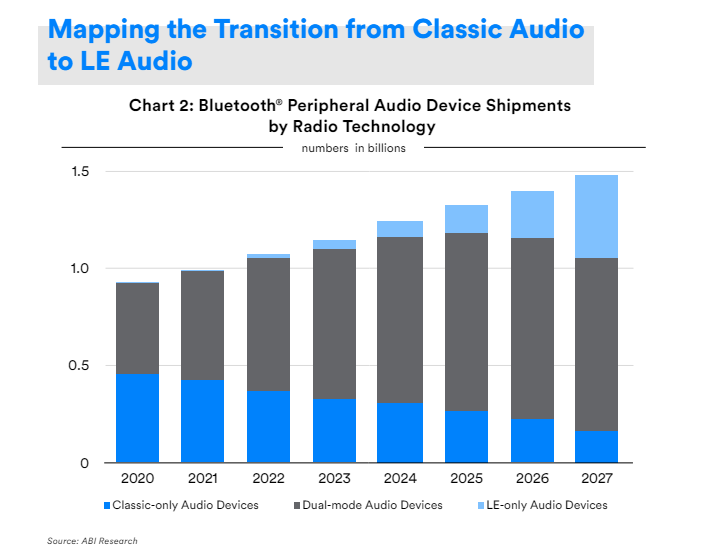
How should we read this chart from the Bluetooth SIG?

This graph was produced from API Research for the Bluetooth SIG. We downloaded this with the team and were wondering how to read it. Here are our key take aways:
- It’s 4 years late! This chart is obviously quite old and obviously optimistic. As we are in 2024 and are just starting to see a very few Dual Mode Bluetooth Peripheral devices: OnePlus Buds Pro 2, Sony INZONE buds, WF-1000XM5, Samsung Galaxy Buds2 Pro, Creative Zen Hybrid Pro and Earfun Air Pro 3. So we can say that we are 4 years later than what this chart shows.
- But it’s coming! The Auracast feature that allows to broadcast audio or music to an unlimited number of devices in range is too good to miss. Think party mode (100s of Bluetooth speakers connected with no glitch), think infrastructure and announcement, think audio sharing. Also, the low latency (~20ms is standard) and battery life will be handy.
- And it will complement Classic: With people holding onto their phone for longer and the huge ecosystem that is now built on Bluetooth Classic, it will be a few years before we see a profound impact on personal wireless Audio. Classic also retain some advantages, If you are looking for the best Audio quality, aptX and aptX lossless still offer the highest level of Audio quality over Bluetooth Classic.
So what will happen is most new Peripheral devices will be designed with Dual Mode in mind: Classic for backward compatibility and LE Audio to enables these new exciting use cases.
In our case, we have bases IOT747 strategy on this chart (although moved by 4 years) and have released the IDC777 where we want to serve that large grey middle sector (Dual Mode Peripheral Devices) with the best available solution.
